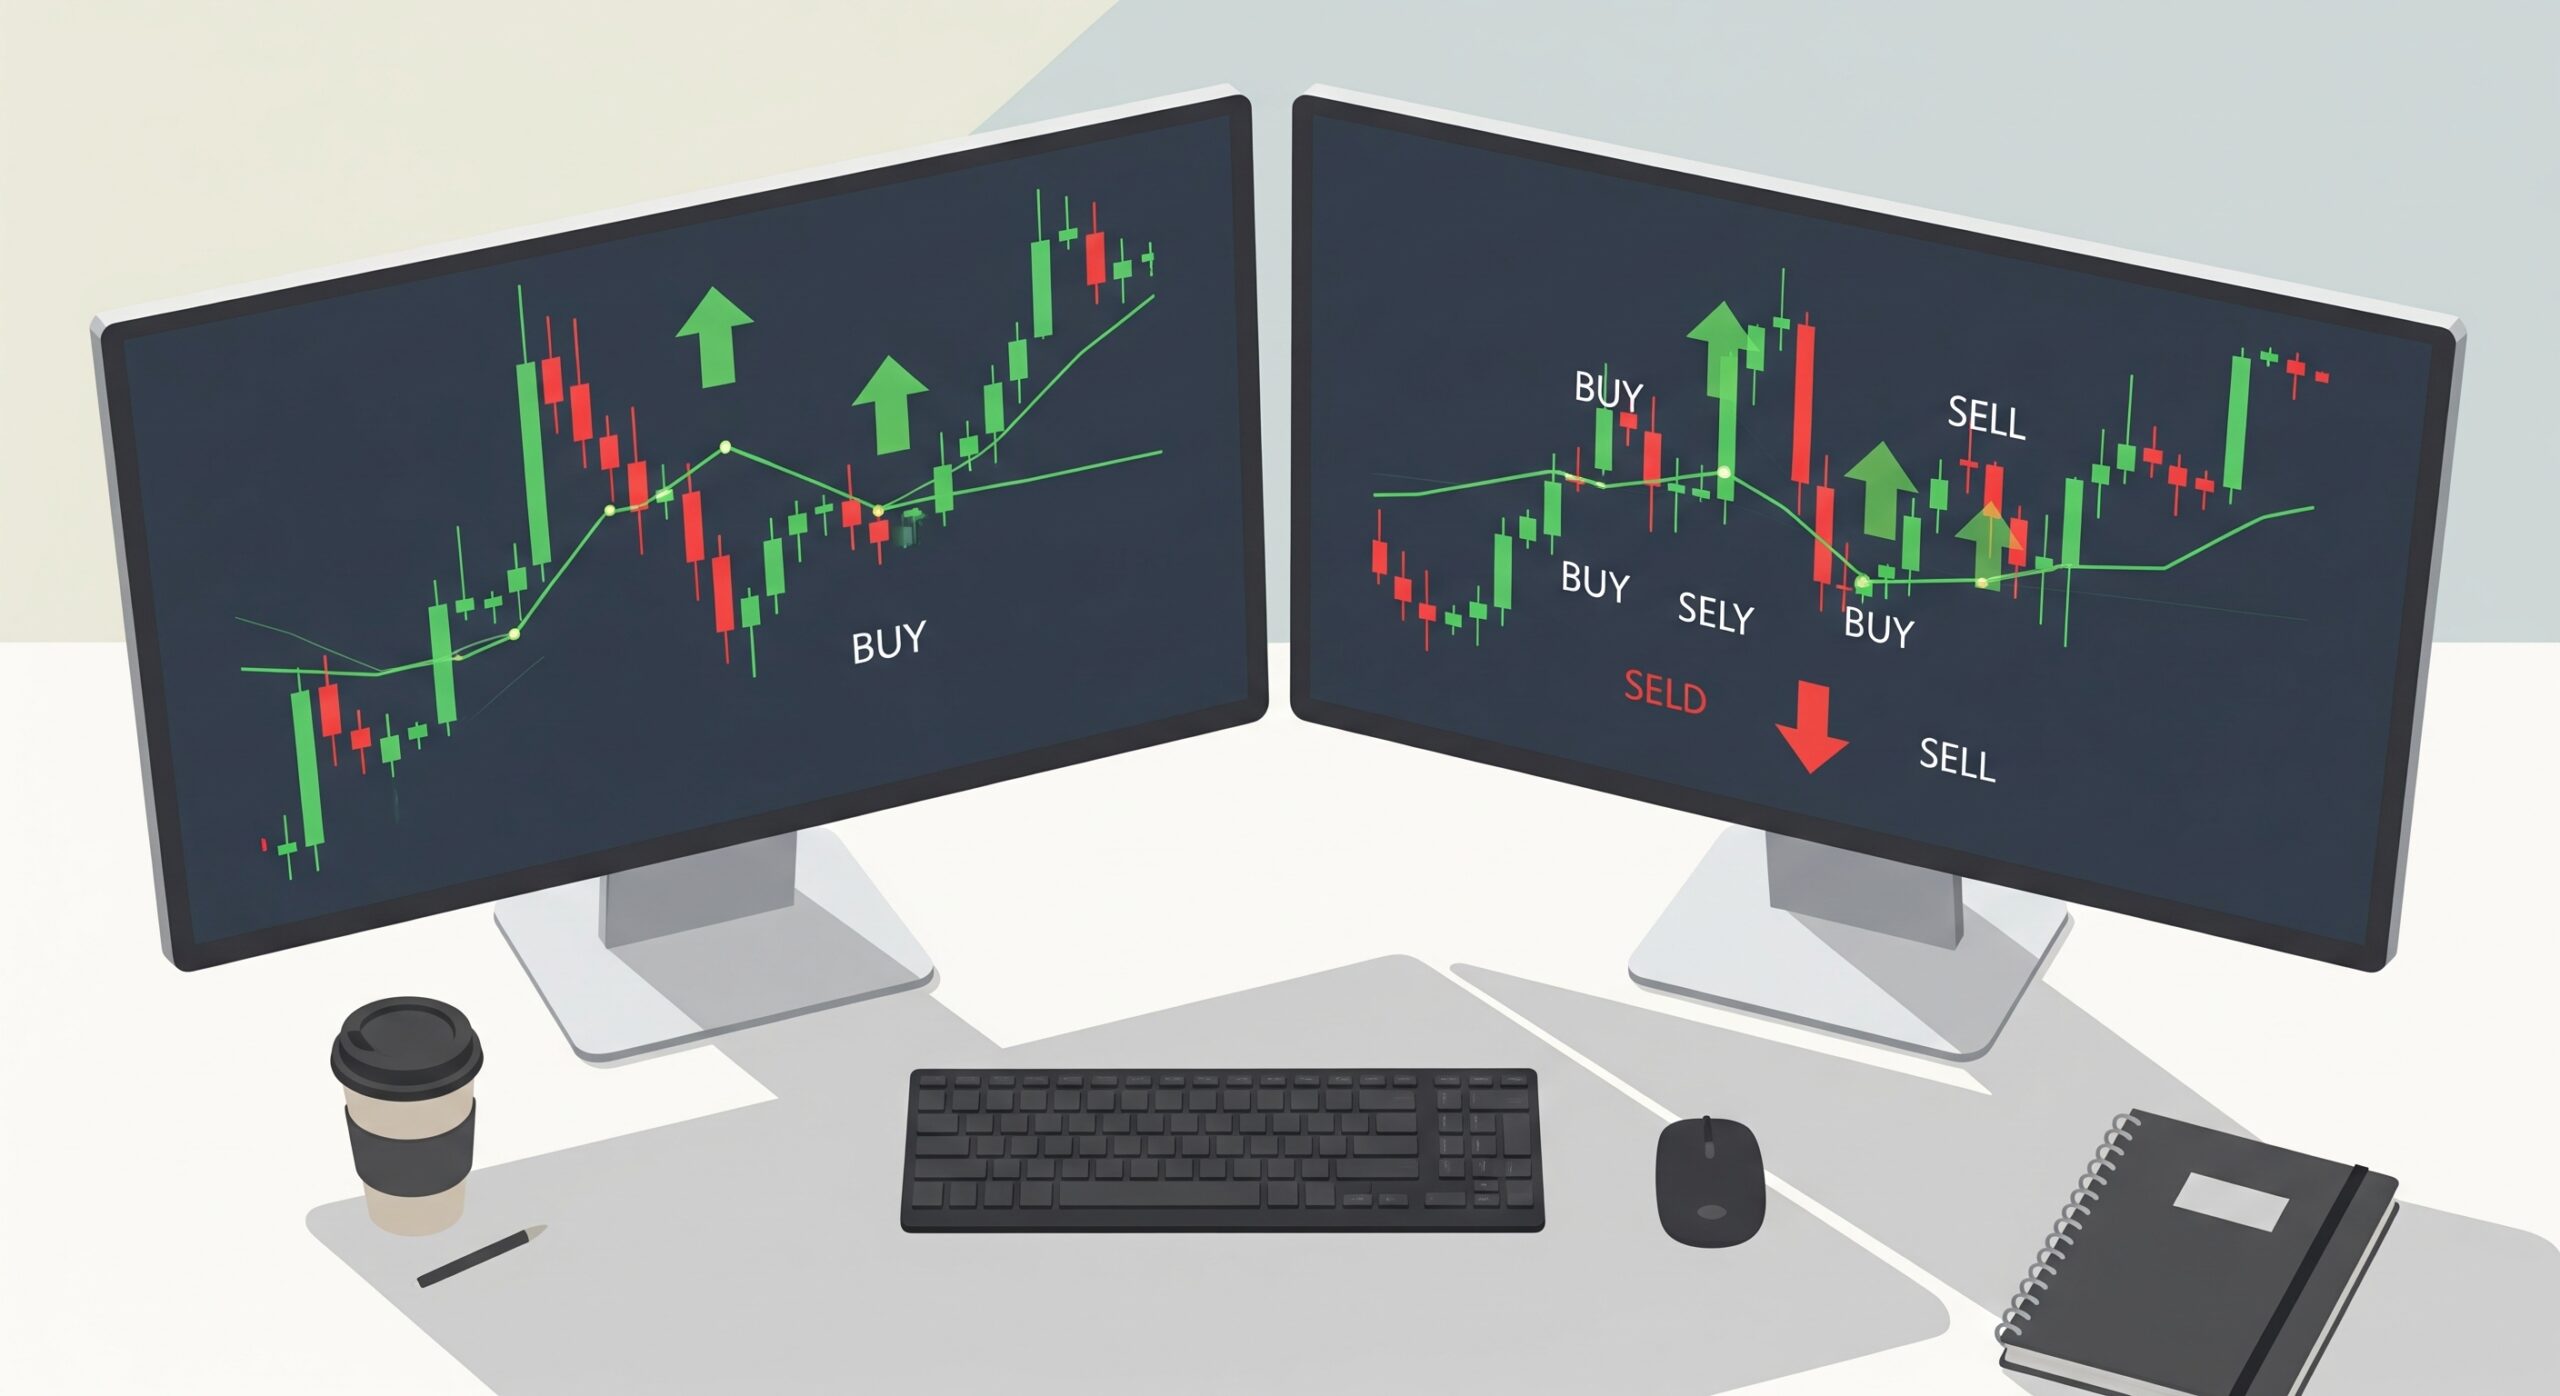
I still remember the night I bought a top because a “guru” on Telegram said the coin was about to “moon.” No indicator, no plan, just vibes and hope. I lost 30% of that trade in six hours. That was the night I stopped trading on feelings and started trading on charts.
If you’ve ever stared at a candlestick chart wondering, “Do I buy now or wait?” you’re not alone. Every trader, including me, has been there. The good news? You don’t need to guess anymore. TradingView has built-in tools that quietly do the heavy lifting for you, and today I’m going to walk you through the 5 best TradingView indicators for buy/sell alerts that I personally keep on my charts, day in and day out.
No fluff, no jargon dump. Just what works, what doesn’t, and how you can use it starting today.
⚡ Featured Web3 Resource
Verify smart contracts, track on-chain assets, and audit token security instantly using our recommended platform.
Access Verified Web3 Tool →Why People Are Shifting Toward Indicator-Based Trading
A few years back, most retail traders just “eyeballed” charts. Now, more people are leaning on data because emotions are the number one reason traders lose money. You panic-sell at the bottom; you FOMO-buy at the top — sound familiar?
Indicators remove a chunk of that emotional noise. They give you a rule: RSI says “oversold,” buy zone. MACD crosses down: exit signal. It’s not perfect, but it’s a lot more consistent than “this coin feels bullish.”
That’s really why so many crypto traders are searching for the best tradingview indicators 2026 has to offer — not because indicators are magic, but because they turn guessing into a system.
Why You Should Have At Least One Reliable Indicator On Your Chart
Here’s the honest truth: trading without an indicator is like driving at night with your headlights off. You might get lucky for a while, but eventually, you’re going to crash.
Even if you’re a long-term holder who believes in dollar-cost averaging, having one solid indicator helps you avoid buying during obvious euphoria or selling during obvious panic. It’s not about predicting the future perfectly — nothing does that; it’s about stacking the odds in your favor.
If you’re still unsure whether trading or investing in crypto fits your life at all, it’s worth reading should you invest in crypto before going further. Indicators only matter once you’ve decided crypto has a place in your portfolio.
My Personal Case Study
When I started managing portfolios for clients, I relied purely on price action. It worked until it didn’t. In one brutal week during a sharp bear leg, I held a position too long because I was “waiting for a bounce.” I lost almost 18% of that allocation.
After that, I built a simple 3-indicator stack: Supertrend for direction, RSI for timing, and Volume Profile for confirmation. My win rate on short-term trades went from roughly 45% to consistently sitting above 60% over the following months. That’s not a promise you’ll get the same results — markets are markets — but it shows why a repeatable system beats gut feeling every single time.
Now let’s get into the actual tools.
1. Supertrend Indicator — The Most Direct Buy/Sell Indicator On TradingView
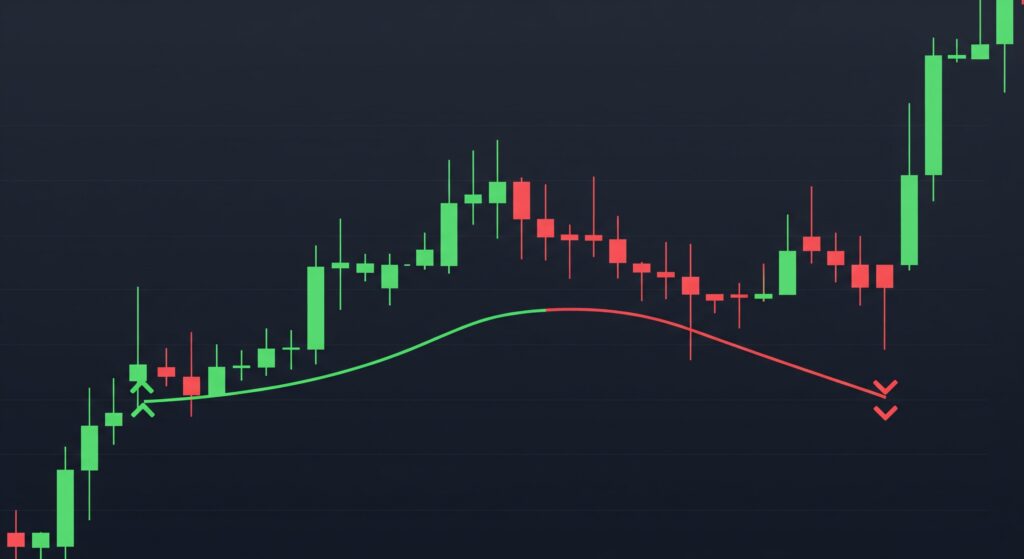
If you want a straightforward tradingview buy/sell indicator, Supertrend is where most traders start. It plots a single line above or below the price. When the price flips above the line, you get a green “buy” signal. When it flips below, you get a red “sell” signal.
Why I like it:
- Dead simple to read, even for beginners
- Works well in trending markets like Bitcoin during strong bull or bear runs
- Great as your best indicator tradingview has for people who don’t want fifteen lines cluttering their screen
Where it struggles:
- In sideways, choppy markets, it gives false signals, sometimes called “whipsaws.”
- It’s a lagging indicator, meaning it confirms a trend after it’s already started
My honest take: I use Supertrend as my main trend filter, not my only signal. I only take buy signals from other indicators when Supertrend also agrees with the direction.
2. RSI (Relative Strength Index) — Best For Spotting Overbought and Oversold Zones
RSI measures how fast and how far price has moved, on a scale of 0 to 100. Below 30 usually indicates an oversold condition (possible buy zone). Above 70 usually means overbought (possible sell zone).
A lot of people search for the most accurate indicator tradingview offers, and honestly, no single indicator is “most accurate” on its own. But RSI comes close to being the most trusted timing tool when combined with trend direction.
Why I like it:
- Free, built into every TradingView account; no need to hunt for a paid script
- Excellent for catching short-term bounces in a broader uptrend
- Works on any timeframe, from 1-minute scalps to weekly swing charts
Where it struggles:
- During strong trends, RSI can stay “overbought” or “oversold” for a long time, which tricks new traders into exiting too early
- Not reliable alone during major news events or sudden volatility spikes
My honest mistake: Early on, I used to short every asset the second RSI touched 70. During the 2021 bull run, that cost me repeatedly, because strong coins stayed overbought for weeks. Lesson learned: RSI needs context, not blind trust.
3. MACD (Moving Average Convergence Divergence) — Best For Confirming Trend Shifts
MACD tracks the relationship between two moving averages. When the MACD line crosses above the signal line, it’s often read as a buy cue. When it crosses below, it’s read as a sell cue.
This is one of the tradingview indicators buy sell traders lean on most for swing trading because it filters out a lot of short-term noise compared to raw price action.
Why I like it:
- Great confirmation tool alongside RSI or Supertrend
- The histogram makes momentum shifts easy to see visually
- Works especially well on the 4-hour and daily charts for swing traders
Where it struggles:
- Lags behind price, so you’ll rarely catch the exact bottom or top
- Can produce late signals in fast-moving crypto markets, especially during high volatility
If you’re building a swing trading approach and want to understand how bull and bear phases affect these signals, this piece on bear and bull markets pairs really well with MACD analysis.
4. Volume Profile / VWAP — Best Volume Indicator TradingView Offers For Scalping
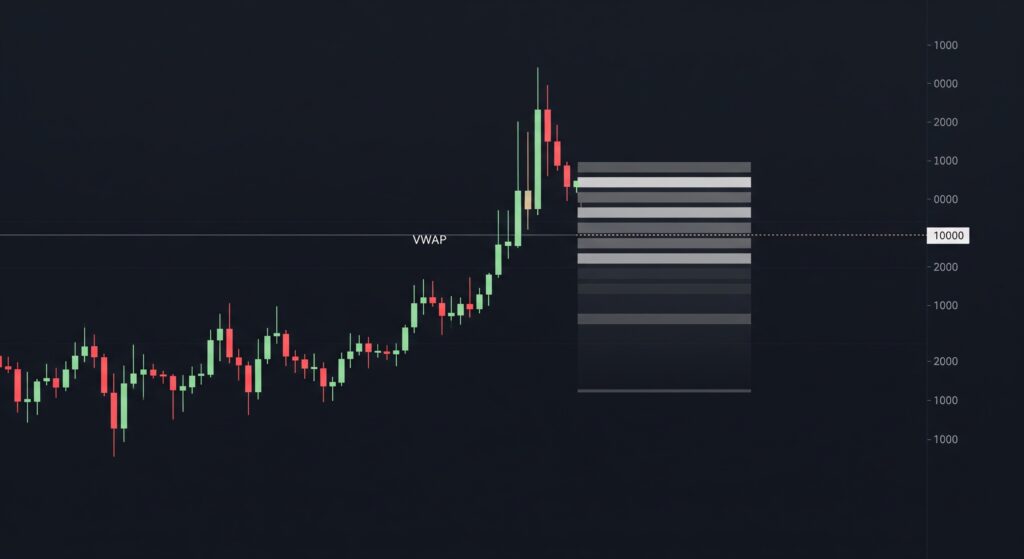
This is the one most beginners skip, and it’s the one I personally consider a game-changer. A volume profile shows you exactly where the most trading activity happened at each price level, not just how much volume happened over time. VWAP (Volume Weighted Average Price) gives you the average price weighted by volume during a session.
For anyone hunting the best crypto scalping indicator tradingview has, this is it. Scalpers live and die by knowing where real buying and selling pressure sits, not just where the price is right now.
Why I like it:
- Shows real support and resistance zones based on actual trades, not guesswork
- One of the best tradingview indicators for crypto scalability because it updates live during high-volume sessions
- Institutional traders use it too, so it tends to align with where “smart money” is active
Where it struggles:
- Takes a bit of practice to read correctly; it’s not as instantly obvious as a colored arrow
- Less useful on very low-volume altcoins where the data gets noisy
Liquidity plays a huge role in how reliable this indicator is. If you haven’t already, it’s worth understanding liquidity in cryptocurrency before you build a scalping strategy around volume profile, because thin order books can trigger fake volume spikes.
5. Bollinger Bands — Best For Swing Trading and Volatility Reads
Bollinger Bands wrap a price channel around the chart using a moving average plus standard deviation. When the price touches the lower band, it often signals a potential buy zone. When it touches the upper band, it often signals a potential sell zone.
This is a favorite among the best tradingview indicators for swing trading because it adapts automatically to volatility instead of using fixed levels as RSI does.
Why I like it:
- Visually shows you when a coin is “stretched” too far from its average price
- Band squeezes (when the bands tighten) often warn of a big move coming, which is huge for swing traders positioning early
- Simple enough to combine with RSI for a two-indicator confirmation system
Where it struggles:
- During a strong breakout, price can “walk the band,” meaning it keeps touching the upper band while still climbing, tricking traders into selling too early
- Needs a trending or ranging context to interpret correctly
Quick Comparison Table
| Indicator | Best For | Signal Type | Beginner Friendly | Lag Level |
|---|---|---|---|---|
| Supertrend | Trend direction, buy/sell arrows | Trend-following | Very High | Medium |
| RSI | Overbought/oversold timing | Momentum | High | Low |
| MACD | Trend confirmation, swing trading | Momentum + Trend | Medium | Medium-High |
| Volume Profile / VWAP | Scalping, real support/resistance | Volume-based | Medium | Low |
| Bollinger Bands | Volatility, swing entries/exits | Volatility | High | Low-Medium |
The Killer Strategy: Stacking Instead of Guessing
Here’s the strategy I actually use, and it’s simple on purpose. I don’t chase the single “most accurate indicator tradingview free” tool, because that tool doesn’t exist. Instead, I stack three signals:
- Supertrend tells me the overall direction — I only take trades in that direction
- RSI tells me the timing — I wait for a pullback into oversold (in an uptrend) or overbought (in a downtrend)
- Volume Profile confirms the entry — I only pull the trigger if price is near a high-volume support or resistance zone
Three confirmations, one decision. It’s not exciting, but boring systems are usually the ones that survive. Before you copy this exact setup, it also helps to know where the broader market mood sits — this is why I always check the crypto fear and greed index alongside my charts. Extreme fear plus an RSI oversold signal is a very different trade than extreme greed plus RSI oversold.
What Didn’t Work For Me (So You Can Skip It)
- Using five-plus indicators at once. I once had RSI, MACD, Stochastic, Bollinger Bands, and a custom script all on one chart. It became “analysis paralysis. Pick two or three, max.
- Trusting one signal blindly. A single green Supertrend flip isn’t a trade plan; it’s a suggestion.
- Ignoring the bigger trend. I took counter-trend RSI buys during a heavy bear phase and got run over more than once. Direction first, timing second.
- Automating too early. I tried plugging raw indicator signals into an AI trading bot before I fully understood the logic myself. It’s a powerful shortcut once you know what you’re doing, but it amplifies mistakes just as fast as it amplifies wins if your strategy isn’t solid first.
And one more thing nobody tells beginners: if your indicator-based trades start actually turning a profit, keep records. When tax season hits, tools like the ones covered in the best crypto tax software will save you hours of headache.
Frequently Asked Questions
What is the most accurate buy/sell indicator on TradingView?
There isn’t one single “most accurate” indicator, and anyone claiming otherwise is oversimplifying it. Supertrend is the most direct for buy/sell arrows, but it works best combined with RSI or Volume Profile for confirmation, not used alone.
Which TradingView indicator is best for crypto scalping?
Volume Profile and VWAP are generally considered the best crypto scalping indicators on TradingView because they show real-time buying and selling pressure at exact price levels, which matters most on short timeframes.
Are TradingView’s free indicators good enough, or do I need paid ones?
The five indicators covered here — Supertrend, RSI, MACD, Volume Profile, and Bollinger Bands — are all available on TradingView’s free plan. You genuinely don’t need to pay for accuracy; you need to pay for extra chart layouts and alert limits if you scale up.
Can I set automatic buy/sell alerts using these indicators?
Yes. TradingView lets you set alerts based on indicator conditions, like an RSI crossing below 30, so you get notified without staring at the screen all day. It’s one of the platform’s most underrated features.
Do these indicators work for stocks too, or just crypto?
All five work across stocks, forex, and crypto. Crypto is simply more volatile, so signals tend to trigger faster and need tighter risk management.
Final Thought
Indicators won’t make you rich overnight, and I’ll never tell you they will. What they will do is turn your trading from a coin flip into a system you can actually learn from, adjust, and trust. Start with one indicator, get comfortable, then build your stack the way I built mine — through mistakes, not shortcuts. Your future self, staring at a green candle instead of a regretful red one, will thank you.

Ammar Malik is an independent digital asset researcher and the founder of AmmarMagazine. He specializes in analyzing on-chain security and evaluating technical tools. Through clear, objective crypto resources, Ammar Malik delivers accessible Web3 education to help everyday users navigate the market safely.